There is a companion tool to Where, and is installed as part of the Where software package.
What can There do?
There is of course the answer to the question Where? As such There - the software program - is used to interactively explore the results of a Where analysis.
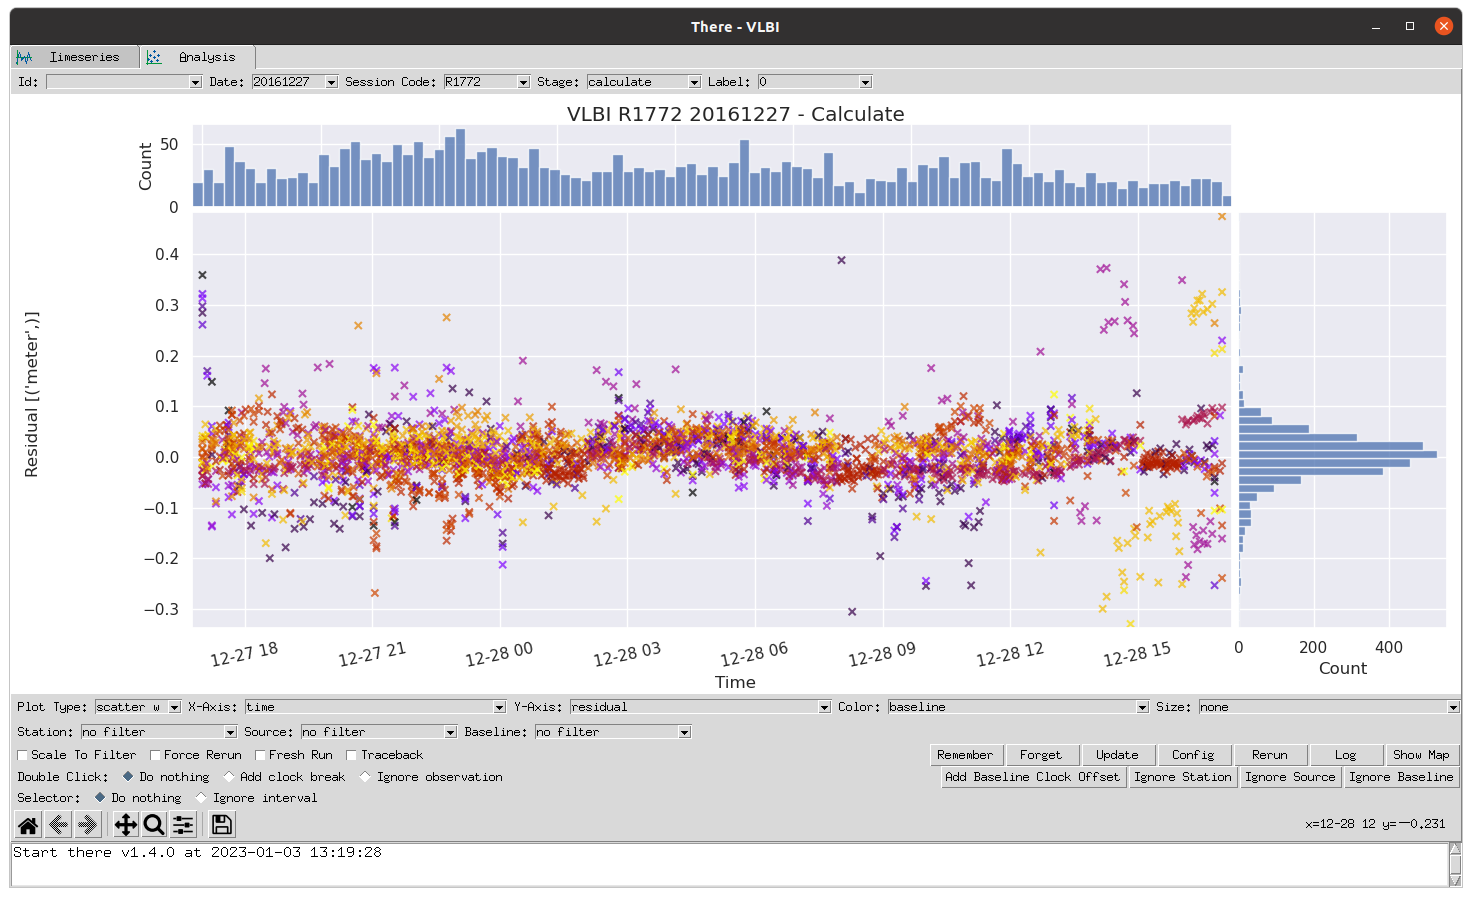
The result of a Where analysis is a dataset which contains timeseries of all relevant variables in the analysis. A normal use of There is to plot timeseries of residuals or estimation parameters, as is seen in the following screenshot:

Figure: A timeseries plotted in There showing the pre-fit residuals after analyzing the VLBI session on December 27 2016
However, There also has more advanced capabilities including:
-
Plotting related timeseries like for instance x, y and z-site coordinates side-by-side or as a 3-dimensional plot
-
Comparing timeseries
-
Filtering timeseries to investigate given stations, radio sources and baselines
There also supports your analysis workflow, by letting you
-
Identify and add clock breaks to an analysis
-
Remove outliers
-
Update the configuration of an analysis
-
Rerun an analysis
Running There
You can start the There program quite simply by issuing the command
there --vlbi
on the command line. This will open the There program. Inside There you can then explore all the analyses you have already done with Where.
Note: On Windows the command to start There is
gd_there. In all examples in this tutorial you should usegd_thereinstead ofthereif you are running on Windows.
Opening a specific analysis
You can also choose to open There showing a specific analysis, by using a command very similar to the one you used for running the analysis. For instance, to open an analysis of the VLBI session for December 27 2016 you would do:
there 2016 12 27 -v --session_code=R1772
Timeseries
If you do not specify a specific analysis the default tab will show you the timeseries dataset. This dataset is intended to compare some parameters across different analyses.
Timeseries is a special dataset that is stored with the date 19700101. This dataset contains many fields with one value for each processed session. For instance by selecting variance_factor for the Y-axis this value can be showed for all processed sessions. Clicking on a point in the plot will print some info about the point in the command line window used to start There. This way sessions with abnormal variance factors can be identified and investigated further. By selecting the Go go analysis behaviour for Double click, and double clicking on a data point in the time series plot, There will switch to the Analysis tab and plot the dataset the selected point was a part of.
Rerunning single sessions
A single session may to some extent be manipulated through There. For instance by selecting a station in the dropdown menu and then pressing Ignore station the station will be added to the ignore_station field in the configuration file. By pressing Rerun the session with be analyzed again and all data from the station will be removed from the analysis.
Clock breaks may also be added by selecting the Add clock break behaviour for Double click, selecting the station that has the clock break and then double clicking on the plot where the clock break should be added. Adding clock breaks or removing observations does not change the results. It only edits the configuration file. More complicated changes to the configuration can be done by clicking the Edit button and writing directly in the configuration file. To apply the changes, the analysis needs to be run again. This is done with the Rerun button.
Customizing There
It is possible to customize much of the look and behavior of There. As with Where, you do this through the configuration.
Any of the settings in config/there.conf can be overridden on the command line. For instance, to
change the colormap and the marker symbol used for scatter plots, you can do:
there -v--colormap=rainbow --scatter:marker=+
There also uses configuration profiles to simplify setting commonly used configuration settings. As with Where you can explicitly specify one or more profiles to apply on the command line:
there -v --profile=projector
The projector profile contains some settings that makes There better suited
for being displayed on the lower resolution that projectors normally deliver. In
addition, there might be profiles associated with pipelines (like VLBI) or
users. These are automatically applied.
To see all available configuration profiles, see the file
there.conf.
To make permanent changes to the default settings, it is recommended to create a new file
called config/there_local.conf and then add the changes to this file. Unlike config/there.conf, the
local version will not be overwritten when a new version of Where is installed. Example config/there_local.conf:
[general]
colormap    = rainbow

[scatter]
marker      = +